ESG, or “Environmental, Social, and Governance” has been a hot topic of conversation across the financial world for years, with its weight and influence on investing decisions and credit profiles continuing to grow and expand. There has been considerable discussion and debate about the implications of considering ESG factors as drivers for investments or credit outcomes, and it is clear that the conversation is far from over. Notably, Moody’s has recently released a new ESG scoring system, which they believe will more clearly and transparently demonstrate how they incorporate ESG factors into credit ratings. Ultimately, these scores will be published for all of Moody’s rated entities, regardless of sector, and as Moody’s begins to release the scores for higher education and nonprofit institutions, questions are beginning to arise as to how the new scoring system works and what impact it may have on borrowers.
Before diving into the details of Moody’s ESG scoring methodology, it is important to first establish what is meant by “ESG.” ESG is defined by Moody’s as “a broad range of qualitative and quantitative considerations that relate to the sustainability of an organization and to the broader impact on society of its businesses, investments, and activities.”[1] There are many metrics that can be considered part of ESG as a whole, but Moody’s has focused on aspects that could materially impact the credit quality of an issuer – particularly the relative risk of default. Moody’s notes that these considerations more often stand to negatively pressure an issuer’s rating than not, and the agency has developed the model to reflect this.
With the basics covered, let’s examine the specific criteria under which Moody’s will evaluate institutions and how that evaluation will play a role in the overall rating outcome. Before considering the specific impacts to individual issuers, Moody’s first created a sector heat map for Environmental and Social metrics (Governance was not included here, as Moody’s determined it to be too issuer-specific to broadly evaluate across sectors).[2] These heat maps, which are described as a lens through which to view each institution within the 80+ global sectors, assess the environmental and social risks inherent to each industry using the criteria shown below. Each metric within the sector is given a score of very high, high, moderate, or low risk. This is known as a “sector category score.” During a panel discussion earlier this year, Moody’s identified sectors that are “high risk” or “very high risk” in the environmental and social categories. [2] For example, Education and Not-for-profits are included in the high-risk category on the social risk heat map. Moody’s believes that the sector faces very high risk from demographic and societal trends, high risk from customer relations and human capital, and low risk for health and safety and responsible production. Shown below is a full breakout of the criteria used for sector category scores and issuer category scores.
Environmental
- Physical Climate Risks
- Carbon Transition
- Water Management
- Waste & Pollution
- Natural Capital
Social
Private Sector
- Customer Relations
- Demographic & Societal Trends
- Human Capital
- Health & Safety
- Responsible Production
Public Sector
- Access to Basic Services
- Demographics
- Education
- Health & Safety
- Housing
- Labor & Income
Governance
Private Sector
- Financial Strategy & Risk Management
- Organizational Structure
- Structure, Policies & Procedures
- Compliance & Reporting
Public Sector
- Institutional Structure
- Policy Credibility & Effectiveness
- Budget Management
- Transparency & Disclosure
Source: Moody’s Investors Service
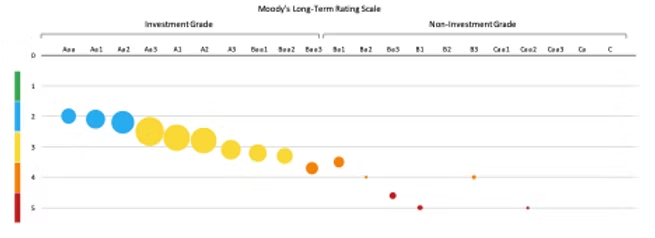
Through the lens of the sector category score, issuers are scored 1-5 (1 being the best) on the individual criteria within E, S, and G. Those scores are then combined to arrive at an issuer profile score (IPS) for each of the three categories, which also range from 1-5. The issuer profile scores are contemplated as the overall credit rating is formulated, and when the credit rating is assigned, Moody’s will also give an overall ESG credit impact score (CIS). This CIS score measures the impact of ESG factors on an issuer’s credit rating, but is not a direct amalgamation of the issuer profile scores. The credit impact score ranges from CIS-1 to CIS-5. CIS-1 indicates that present ESG attributes are having a positive impact on the rating, or that the rating would have been lower in the absence of ESG considerations. Very few 1s exist even at the issuer profile score level, and there are no higher education or non-profit issuers with a CIS-1 score at this time. CIS-2 is a neutral-low impact score, and the ratings continue down to CIS-5 which is a “very highly negative” score.
A CIS-4 or CIS-5 score typically indicates that ESG considerations are material negative factors impacting an issuer’s rating, which may have been better in the absence of those factors. An example of this is the impact of current demographic trends in some areas of the country on higher education borrowers’ Social ESG scores – in many cases, negative trends such as a declining number of high school graduates are drivers of a lower rating outcome than an institution’s financial metrics might otherwise suggest. Moody’s notes that since CIS is only a single piece of the broader rating, there is not a direct relationship between the two: a strong credit rating does not necessarily imply a positive CIS score, nor does a weaker credit rating imply a negative CIS score. That being said, there is a clear trend in the higher education sector for lower-rated entities to have higher (“worse”) CIS scores than their higher-rated counterparts, as shown in the chart below, indicating that there is at least some correlation between credit ratings and CIS scores for higher education borrowers. Lucia Lopez, a Senior ESG Credit Officer at Moody’s, stated during the aforementioned panel discussion that where there are material benefits or risks to issuers, they have already been incorporated into the qualitative factors under the existing scorecard methodology and thus, there is no expectation for ratings to change with the roll out of the new ESG scores.
While this direct incorporation of ESG scoring may seem like a major new development for rating agencies, Moody’s has indicated it does not represent a change in the way that they think about ESG aspects in the formulation of a rating. Rather, with ESG considerations already baked into existing ratings, the stated goal for the new scoring system is to add transparency into exactly how ESG metrics have impacted any given rating outcome. ESG scores have been rolling out on an ongoing basis over the past year, with the higher education sector beginning to receive scores over the past several months. Moody’s hopes to achieve full coverage for all rated issuers by 2023. In September, Fitch announced its intention to launch its own ESG Ratings, Data & Analysis product as well. This increased emphasis on ESG is likely a trend that will continue as ESG becomes a more ingrained piece of global financial and credit markets. If you have questions about Moody’s ESG scores for your institution, we encourage you to reach out to a Blue Rose advisor to discuss this topic further.
[1] For additional information, see “General Principles for Assessing Environmental, Social and Governance Risks Methodology,” published October 29, 2021, by Moody’s.
[2] See “ESG Scores Explained: Quantifying the degree of credit impact,” March 8, 2022 webinar by Moody’s.
Comparable Issues Commentary
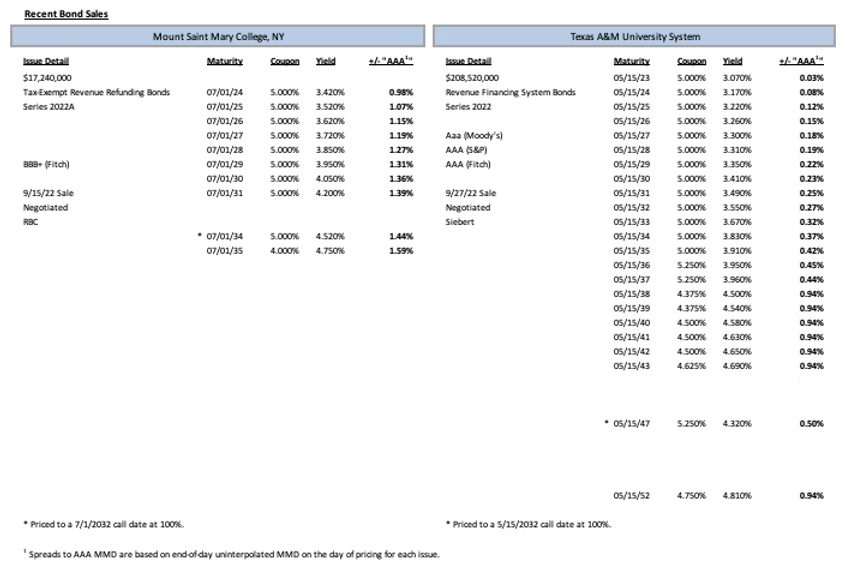
Shown below are the results of two higher education financings that priced in the month of September, showcasing the range of credit spreads seen across the rating spectrum in the current market. On September 15th, Mount Saint Mary College (“MSMC”) of New York priced its tax-exempt Series 2022A. Just under two weeks later, the Texas A&M University System (“Texas A&M”) priced its tax-exempt Series 2022 on September 27th. Mount Saint Mary’s 2022A bonds were a refunding issue that refunded the College’s Series 2012C bonds. MSMC also issued a smaller concurrent taxable Series 2022B of just under $1.2MM in par amount to finance the termination of an interest rate swap associated with the College’s 2012C bonds. The Texas A&M System’s Series 2022 was a multi-purpose issuance. A portion of the issue was used to refund outstanding notes. The remaining proceeds will fund a variety of projects throughout Texas A&M’s campuses.
Both schools’ bonds carried ratings from Fitch Ratings (“Fitch”), with Texas A&M also carrying ratings from Moody’s Investors Service (“Moody’s”) and Standard & Poors (“S&P”). The two institutions differed significantly in credit quality, with MSMC’s Fitch rating coming in at a “BBB+” while the Texas A&M system received “Aaa” or “AAA” ratings from all three rating agencies. The transactions also differed materially in size – MSMC’s Series 2022A totaled $17.24 million in par, while the Texas A&M deal was much larger at $208.52 million. As a refunding issue with no new money component, Mount Saint Mary’s transaction had a shorter amortization than that of the Texas A&M system. It featured serial maturities from 2024-2031 and 2034 as well as a term bond covering the 2032-2035 maturities. The Texas A&M system, on the other hand, had a full 30-year amortization which featured serialized maturities from 2023-2043 with two term bonds on the long end of the curve in 2047 and 2052. Both issues featured a standard 10-year call provision in 2032. Each transaction also featured mainly 5% coupons on their earlier maturities, with Mount Saint Mary’s using a single 4% coupon on its 2035 term bond. The Texas A&M System utilized a blend of different coupons including 5.25% in 2036 and 2037 as well as on the 2047 term bond, but primarily shifting to 4% handle coupons for most of its longer-dated maturities after 2037. Both institutions pursued a negotiated sale.
Mount Saint Mary priced into a difficult market in mid-September, as MMD jumped 8-17 bps in the two weeks from September 1st leading into MSMC’s pricing. On the day of pricing too, MMD increased again by 3 bps across the curve. The college was ultimately able to achieve spreads of 98-144 bps on its serial maturities and 159 bps on the single 4% term bond. Following this pricing, MMD continued to climb, with the Fed meeting on September 21st accelerating this upward trend. By the time of Texas A&M’s pricing on the 27th, MMD had risen a further 25-65 bps across the curve relative to its levels after the MSMC pricing, with most of the larger cuts coming on the first 4-5 years of the curve. Altogether MMD increased 45-78 bps from the start of the month. The Texas A&M System was able to achieve spreads of 3-45 bps on its 5% handle coupons before widening to 94 bps on the various 4% handle coupons from 2038-2043 and on its 2052 term bond. The 2047 term, which featured a 5.25% coupon, achieved a spread of 50 bps. On average, comparable maturities were spread ~105 bps tighter than those of Mount Saint Mary, averaging out to a differential of approximately 15 bps/rating notch given the 7-notch gap between the two borrowers. Notably, however, spreads have continued to widen during the month of September, even for issuers at the top of the credit spectrum. For example, on September 12th, another “Aaa/AAA” issuer, the University of Texas System priced just under $373 million of tax-exempt debt at spreads ranging 3-14 bps tighter than those of Texas A&M on comparable 5% maturities (8 bp tighter on average). These two similar transactions, priced within the span of just over two weeks, suggest that in the volatile market following the September Fed meeting spreads may have widened materially in several places along the curve. Indeed, the increasing interest rate environment and market volatility have resulted in a lighter supply of higher education deals in the market, with many potential refunding transactions failing to produce meaningful savings and higher borrowing rates limiting some issuers’ appetite for new money issuance.
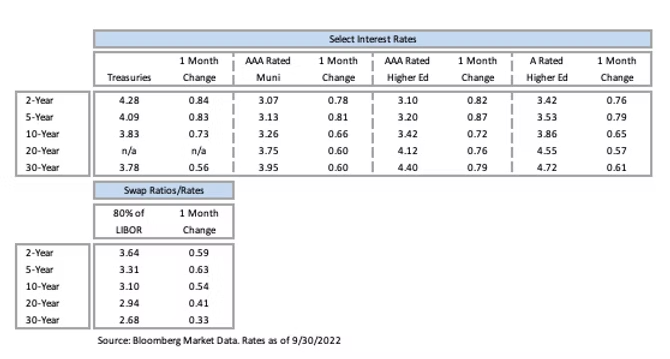
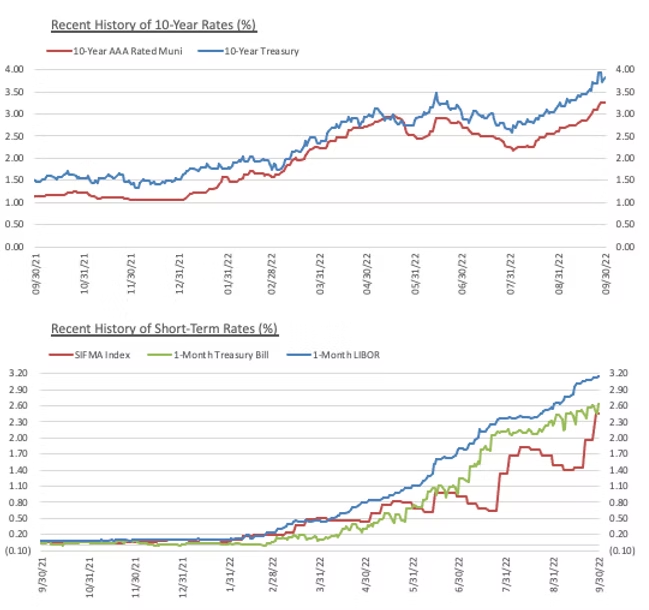
Interest Rates
Ben Pietrek | [email protected] | 952-460-5776
Ben Pietrek joined Blue Rose in 2021 and works as an Analyst. In his role Mr. Pietrek is responsible for providing analytical, research, and transactional support to the lead advisory team serving higher education, non-profit, and government clients with debt advisory, derivatives advisory, and reinvestment advisory services. He is also responsible for credit and debt capacity analyses.
Media Contacts:
Megan Roth, Marketing Manager
952-746-6056
Laura Klingelhutz, Marketing Generalist Intern
Email: [email protected]


